Are your facility’s ESG reports backed by hard operational data or educated guesses? Without precise metrics, driving real environmental progress across your property portfolio is nearly impossible. Tracking key sustainability KPIs helps you measure performance, lower operating expenses, and simplify regulatory compliance.
Source Energy Use Intensity (Source EUI)
Energy consumption remains one of the largest operational impacts of any commercial building. While Site EUI measures energy consumed directly on-premises, Source EUI provides a complete operational picture by combining raw fuel inputs with generation, transmission, and distribution losses.
You calculate Source EUI by dividing total source energy consumption by the building’s gross floor area. To compare facilities across different climate zones or evaluate performance over time without weather distortion, calculate Weather Normalized Source EUI, which adjusts raw consumption against 15-year average local weather patterns.
Using tools like ENERGY STAR Portfolio Manager allows you to convert these inputs into an ENERGY STAR Score. This 1–100 percentile rating benchmarks your facility relative to similar properties nationwide, where a score of 50 represents average performance. Tracking this score provides an immediate baseline for internal operational decisions and external disclosures.
Scope 1, 2, and 3 Greenhouse Gas (GHG) Emissions
Accurate carbon accounting requires evaluating greenhouse gas emissions across all three operational boundaries defined by the GHG Protocol:
- Scope 1 (Direct Emissions): Direct GHG emissions from sources owned or controlled by your organization, such as fuel combustion in boilers, furnaces, and corporate vehicle fleets.
- Scope 2 (Indirect Emissions): Indirect emissions from purchased electricity, heating, cooling, and steam. Accounting guidelines require tracking Scope 2 through both location-based methods (using average grid emission factors) and market-based methods (reflecting specific power purchase agreements or green tariffs). Grid-connected renewable energy carries an emission factor of zero at the point of generation.
- Scope 3 (Supply Chain and Waste Emissions): Indirect emissions occurring across your value chain, including purchased goods, employee commuting, and Category 5 operational waste.
To calculate your footprint, multiply activity data (such as kilowatt-hours of electricity or kilograms of waste) by fuel-specific emission factors and Global Warming Potential (GWP) values to determine total CO₂-equivalent (CO₂e).
When building a long-term net-zero office strategy, facilities managers can significantly curb Scope 3 footprints by focusing on how to reduce office carbon footprint through sustainable procurement. Choosing interior fixtures crafted from renewable birch plywood rather than traditional sheet metal or plastic delivers 2 to 4 times lower CO₂ lifecycle emissions.
Waste Diversion Rate and Contamination Rate
Relying solely on overall waste tonnage can obscure critical operational inefficiencies. To establish actionable metrics, facility managers must monitor both diversion efficiency and sorting quality.
Waste Diversion Rate
The Waste Diversion Rate calculates the percentage of total facility waste redirected away from landfills toward recycling, composting, or material reuse:
Waste Diversion Rate (%) = (Weight of Diverted Material ÷ Weight of Total Waste Generated) × 100
Contamination Rate
Even high recycling volumes are undermined if material sorting quality is poor. Contamination occurs when non-recyclable items are incorrectly placed into recovery streams:
Contamination Rate (%) = (Weight of Non-Recyclable Items in Recycling Bins ÷ Total Weight of Material in Recycling Bins) × 100
Evaluating your capture rate – the proportion of recyclable materials correctly collected – helps pinpoint where employee sorting habits break down.
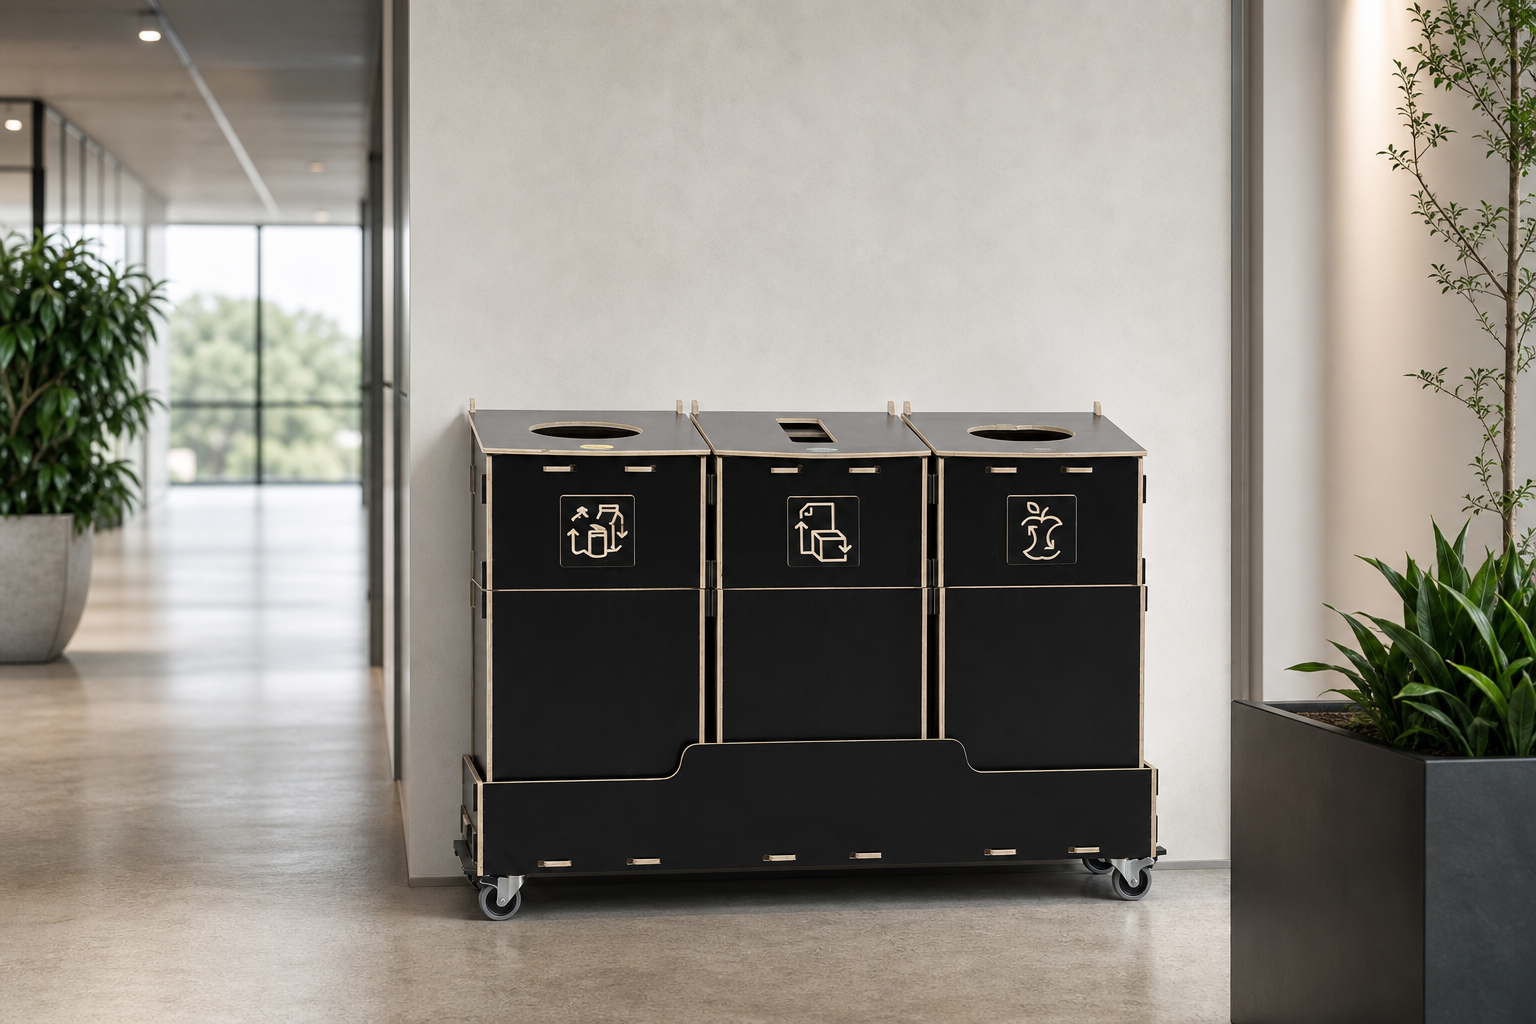
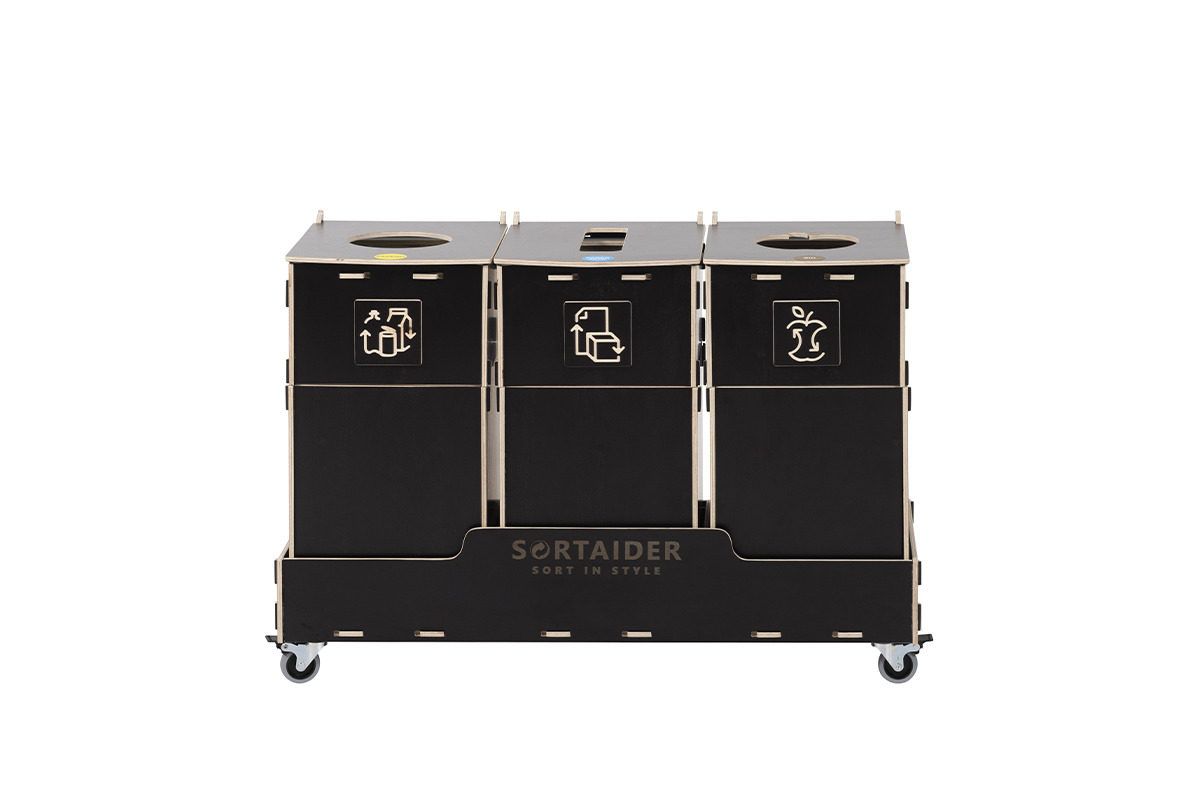
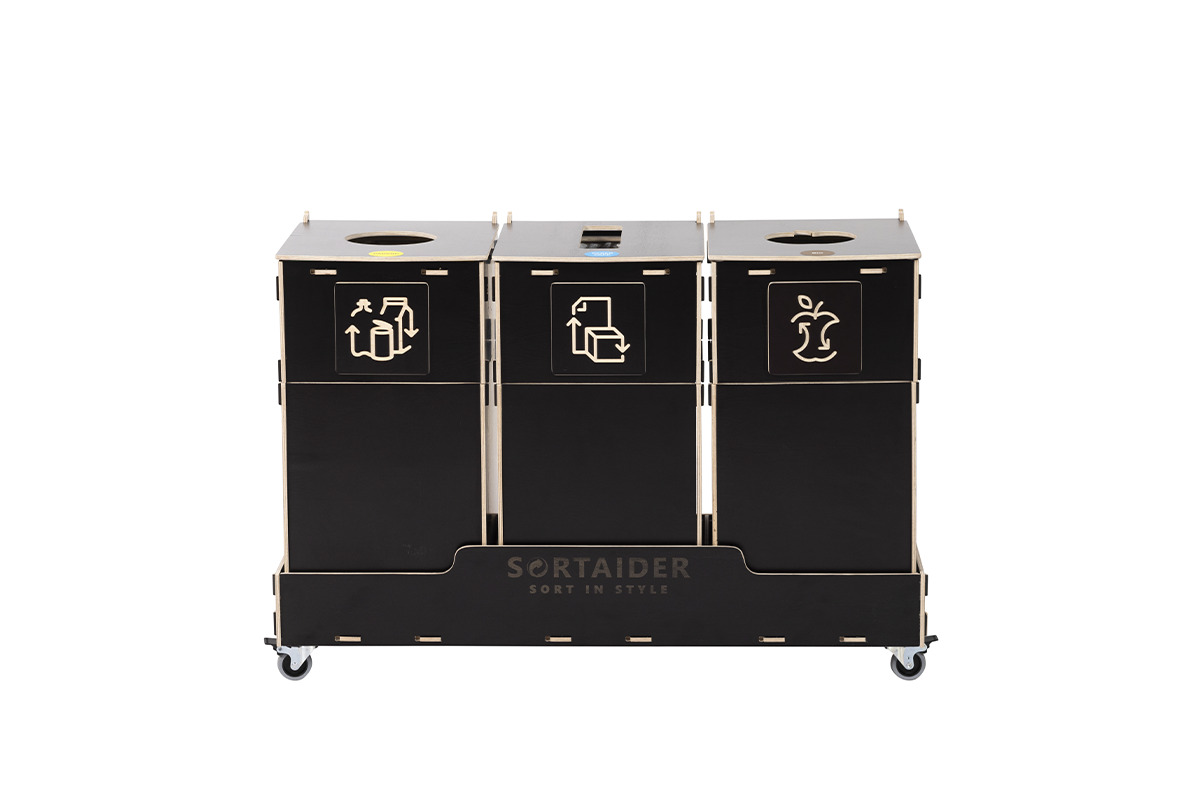
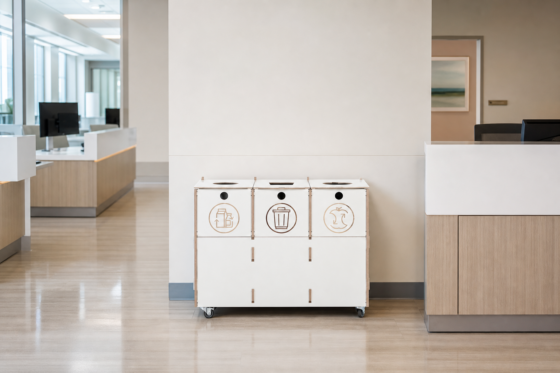
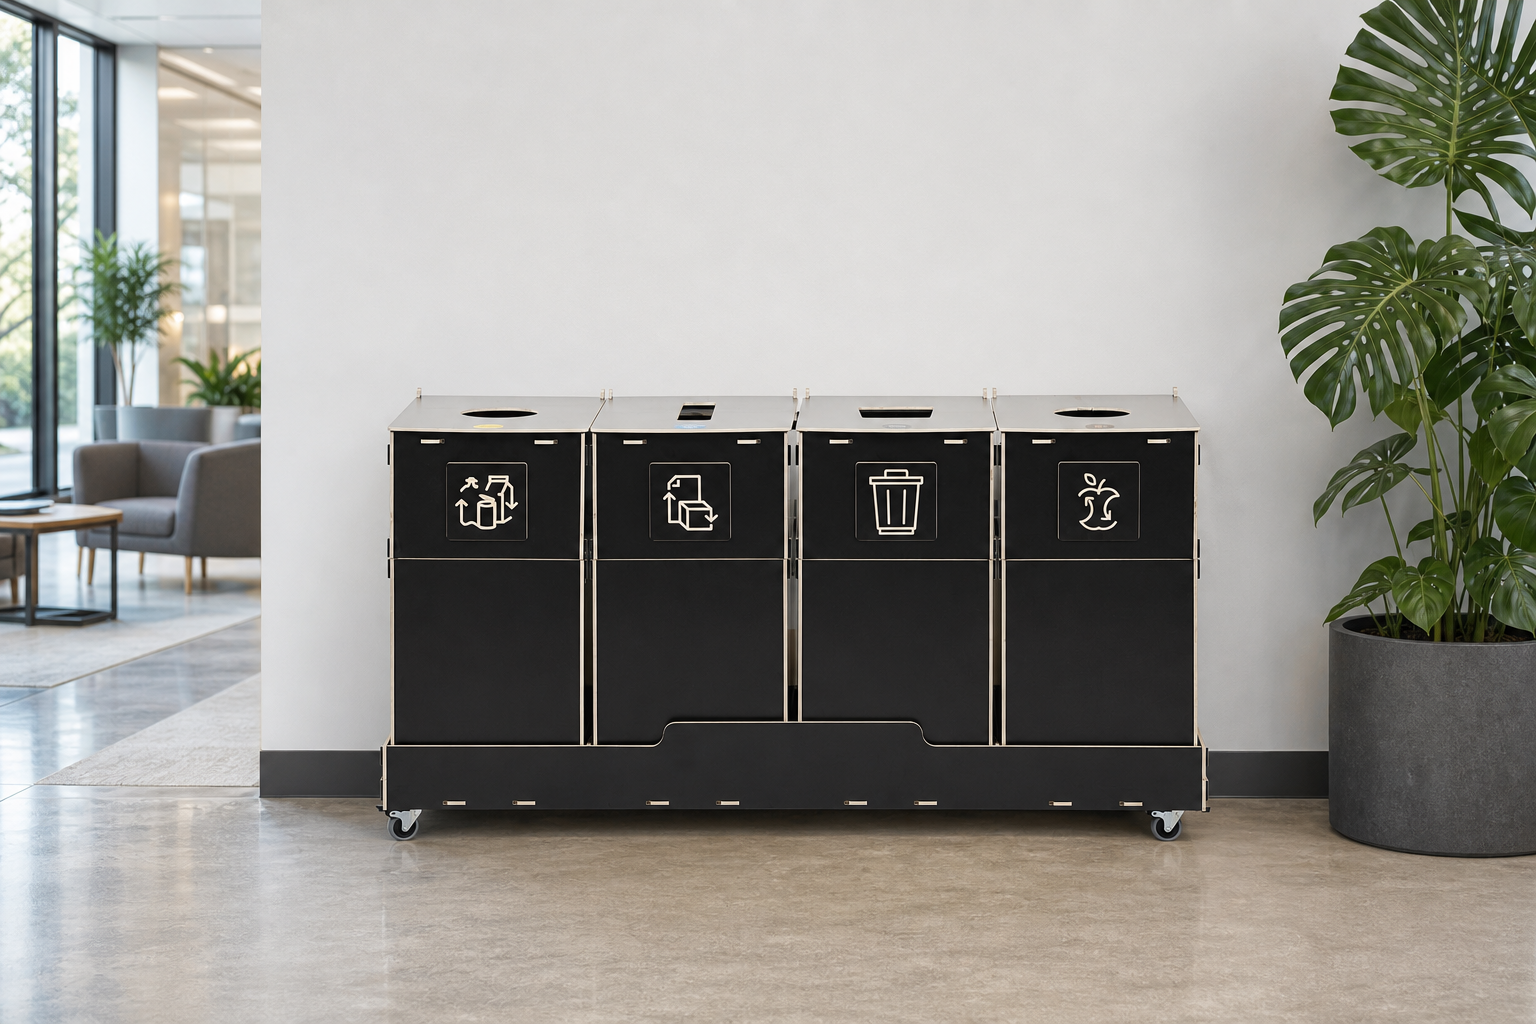
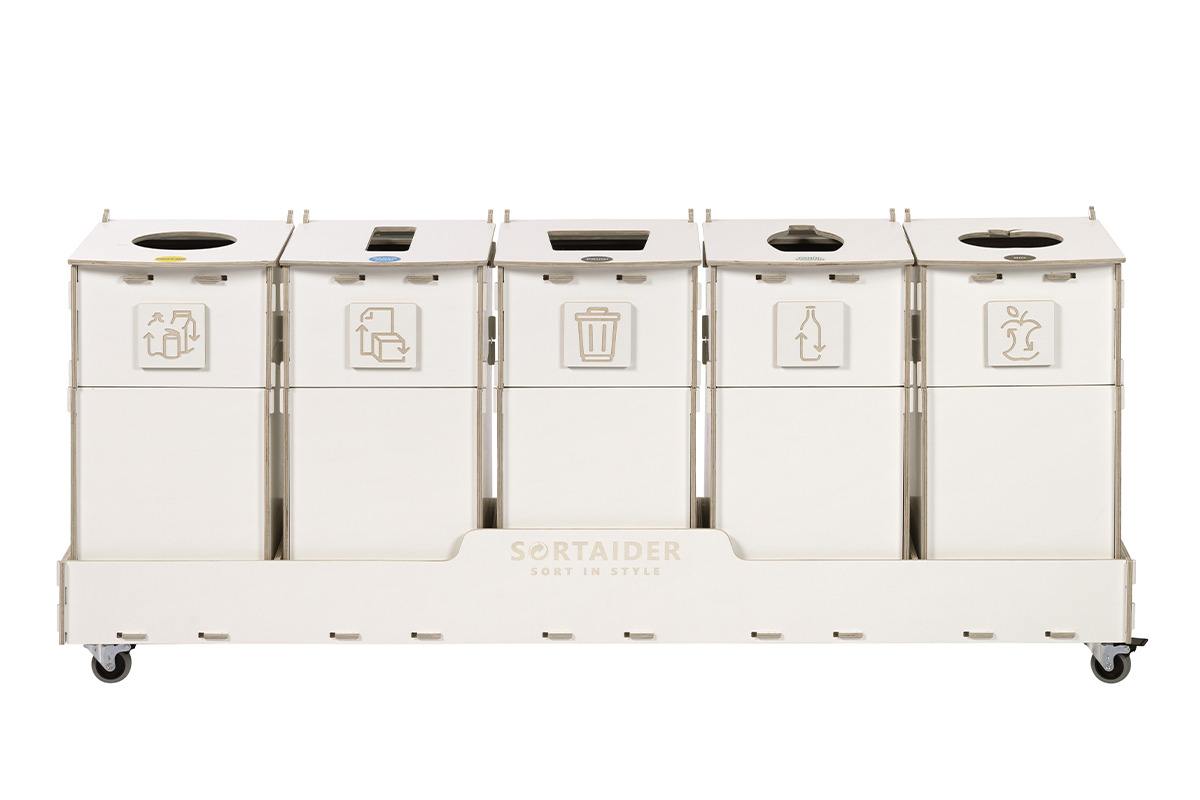
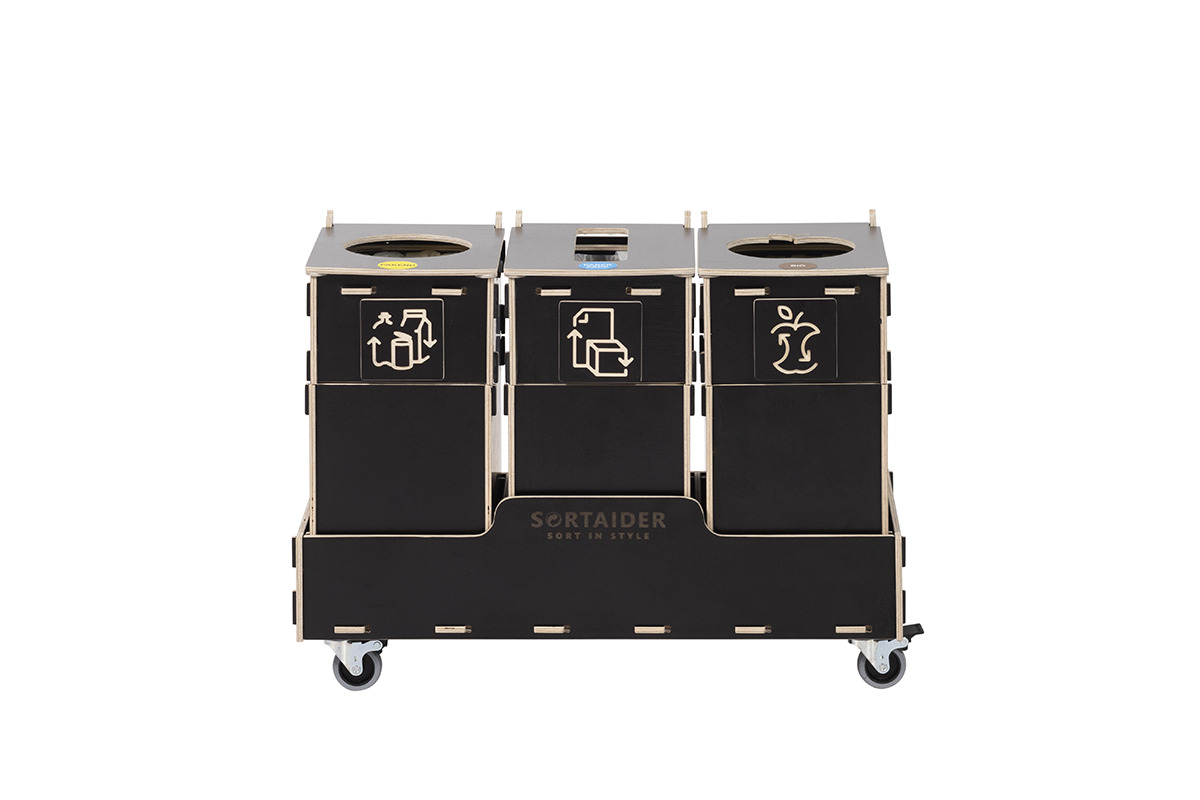
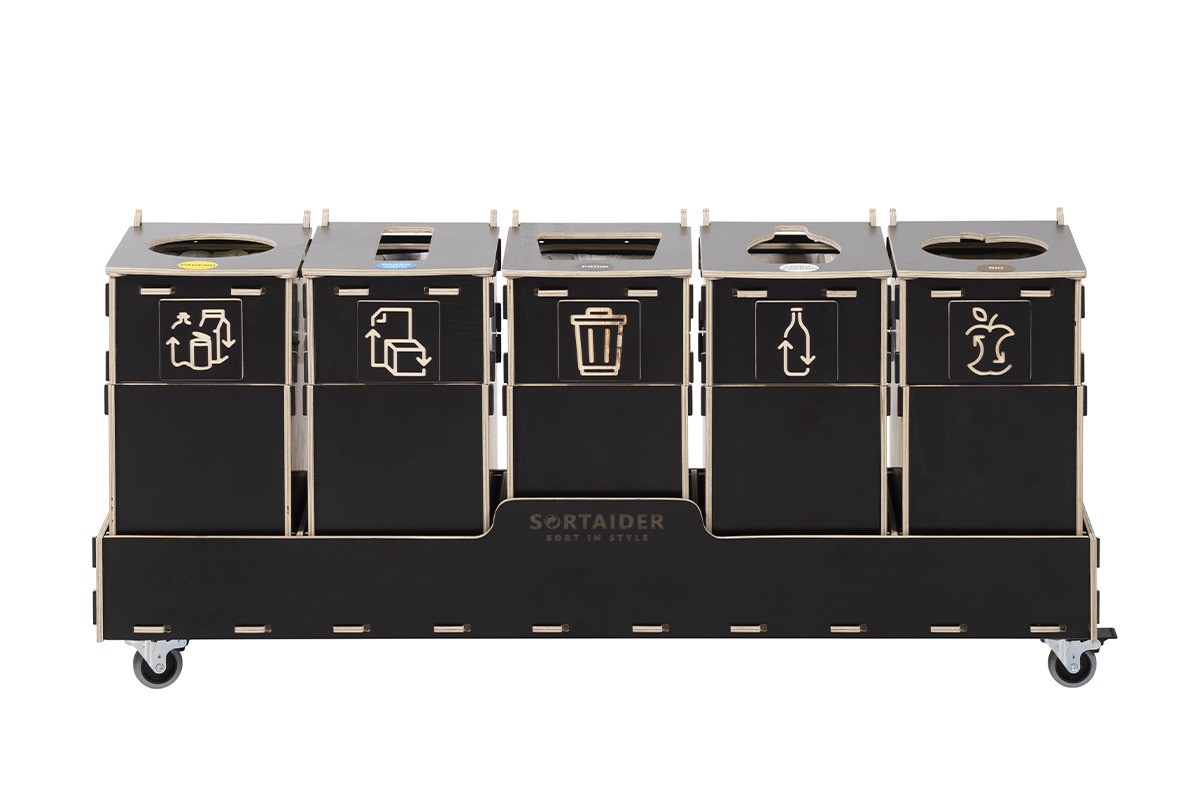
Installing centralized, multi-stream recycling bins equipped with clear pictograms reduces user error and can boost waste diversion rates by up to 40%. Flexible modular systems like the Ecolong series allow facilities teams to adapt sorting hubs from 2 to 5 waste streams as operational requirements evolve.

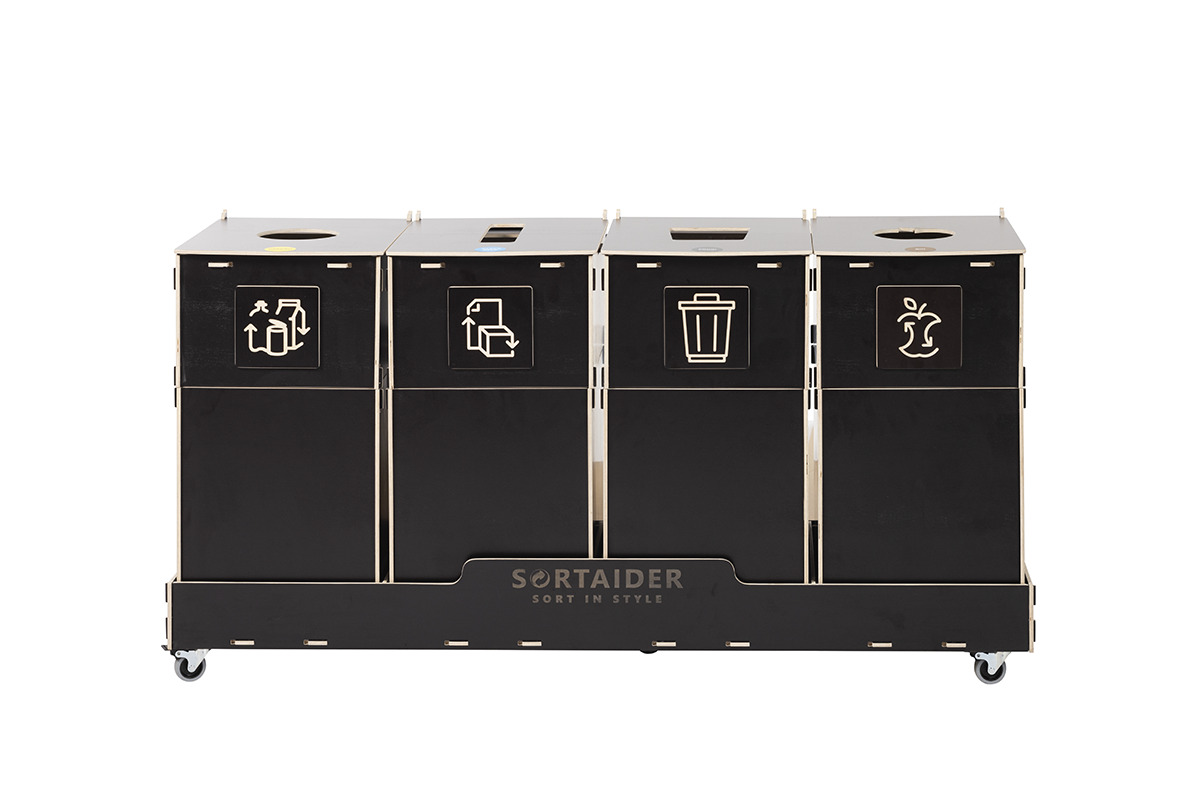
For structured guidance on establishing these measurements, review our guide on how to track and report recycling rates at work.
Waste Generation and Prevention Intensity
While diversion focuses on managing materials already discarded, Waste Prevention Intensity targets source reduction – the primary goal of the waste management hierarchy.
This metric expresses total waste generation relative to business activity, such as tonnes of waste per million euros in revenue or kilograms per building occupant. Normalizing your waste data accounts for business growth and headcount changes over time.
To establish an accurate baseline, conduct a physical waste audit for offices over a 1 to 7 day period. Collecting and weighing separate material streams from key zones – such as kitchenettes, print stations, and main hallways – provides the empirical foundation required for ESG waste management reporting. This detailed baseline supports a circular economy for businesses and ensures compliance under an ISO 14001 environmental management system.
Regional Compliance Note: European facilities face strict regulatory obligations under regional implementations of EU waste directives. Across Nordic and Baltic markets, failure to separate commercial waste streams at the source can trigger significant municipal contamination fines and elevated haulage tariffs.
Water Use Intensity (WUI)
Water management forms an essential pillar of comprehensive facility sustainability assessments. Water Use Intensity (WUI) measures total annual water consumption normalized by building floor area:
WUI = Total Annual Water Consumed (Liters or Gallons) ÷ Gross Floor Area (Square Meters or Square Feet)
In line with EPA WaterSense at Work guidelines, thorough water benchmarking requires auditing utility bills across all incoming supply lines, cooling towers, irrigation sub-meters, and wastewater discharges. Regularly tracking baseline fluctuations helps facility teams detect sub-surface pipe leaks, cooling tower over-pumping, or equipment inefficiencies before costs escalate.
Refrigerant Leak Rates and Lifecycle Emissions
Fugitive emissions from HVAC systems and commercial refrigeration units represent major high-GWP environmental risks for commercial properties.
To manage these climate risks effectively, track the following refrigerant metrics:
- Annual Emission Leak Rate: The percentage of total system refrigerant charge lost over a 12-month period. High-performance facilities aim to maintain annual leak rates below 15%.
- Lifecycle Fugitive Emissions: Total fugitive losses across installation, daily operation, and end-of-life disposal, converted into CO₂e using compound-specific GWP multipliers.
- Transition Progress: The proportion of cooling equipment successfully converted from legacy hydrofluorocarbons (HFCs) to low- or zero-GWP natural refrigerants.
Indoor Environmental Quality (IEQ) Benchmarks
Sustainable facilities must protect occupant health alongside resource efficiency. The Federal Energy Management Program (FEMP) provides benchmark ranges for core Indoor Environmental Quality (IEQ) metrics that directly reflect ventilation performance:
- Indoor Carbon Dioxide (CO₂): Acceptable concentrations sit below 965 ppm, while high-performance spaces maintain levels under 730 ppm. Spikes in CO₂ point to inadequate outdoor air ventilation rates.
- Fine Particulate Matter (PM2.5): Benchmark guidelines require PM2.5 levels under 25 µg/m³ in occupied spaces, with high-performance spaces targeting less than 15 µg/m³.
- Relative Humidity: Keeping indoor relative humidity within a 30% to 60% range maintains thermal comfort and prevents structural moisture risks.
Driving Continuous Facility Improvement
Systematically tracking these operational metrics transforms complex environmental goals into practical, manageable building upgrades. If you are ready to improve your facility’s waste diversion rates with low-embodied carbon recycling hubs, explore our customizable Sorter series or read our guide to becoming a sustainable business.